Does your business feel like it’s running harder than ever but not getting ahead? You see top‑line revenue climbing, yet margins feel perpetually squeezed. This frustrating dynamic, where the engine is revving but the wheels seem to spin, is often a symptom of The Portfolio Trap—a situation where a product portfolio that looks healthy on the surface is secretly being drained by money‑losing SKUs hiding in plain sight.
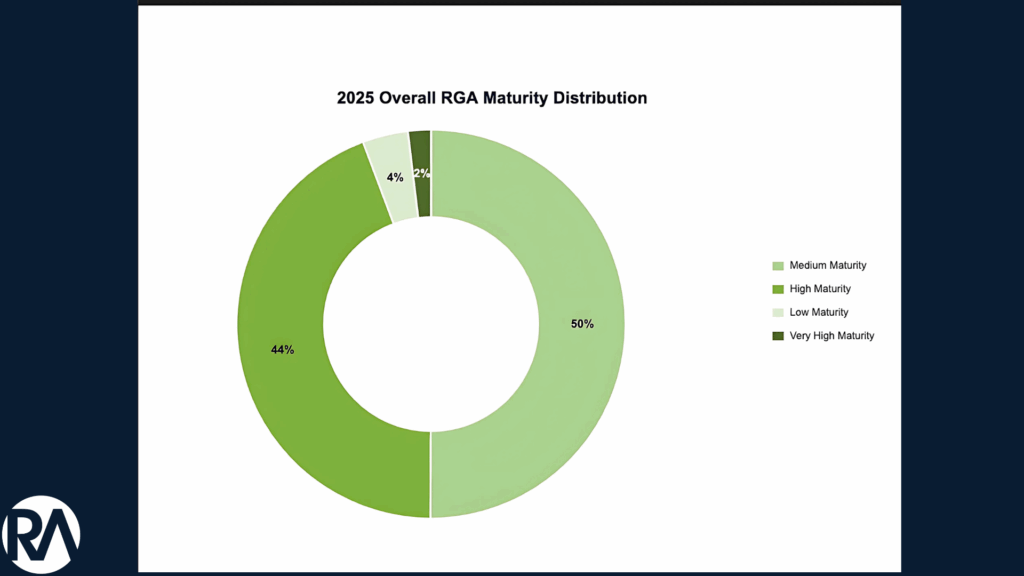
This is a widespread reality confirmed by hard data. The 2025 Revenue Growth Analyti cs (RGA) Maturity Report from Revology Analytics surveyed dozens of commercial leaders and painted a stark picture: a staggering 50 % of organizations are stuck in a “Medium” analytics‑maturity level, with a mere 2% achieving true excellence. This is the definition of being “data‑rich but insights‑poor,” creating the perfect conditions for the Portfolio Trap to take hold.

A second, equally sobering benchmark comes from a landmark 2022 research study on category management in distribution. Its analysis of 140 publicly traded distributors shows that every one‑percentage‑point improvement in cost‑of‑goods‑sold (COGS) expands EBITDA by 18 % or more, yet only a handful of “outperformers” capture that upside.
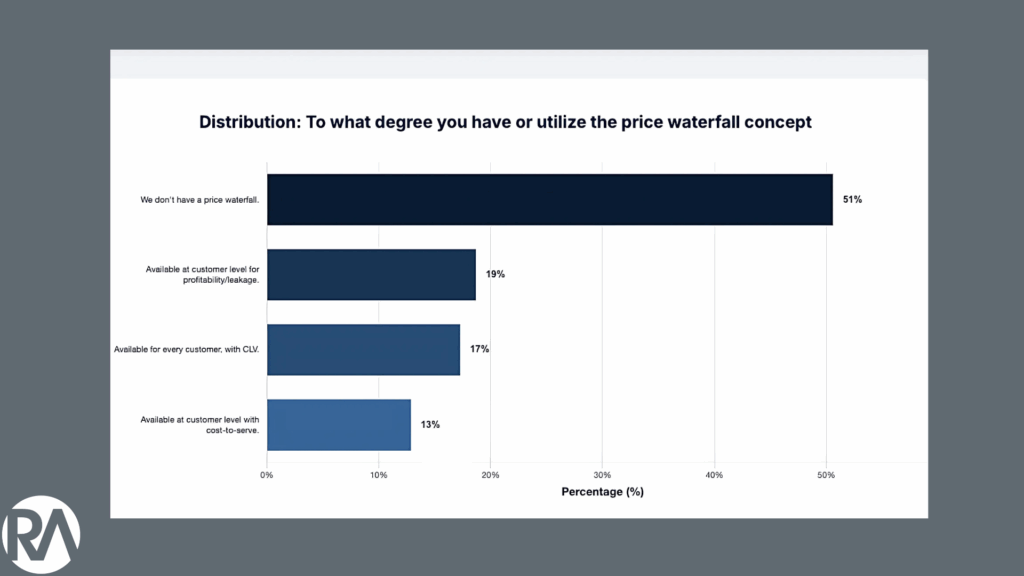
The report’s most telling discovery lies in one damning statistic from our own RGA study: over half of all businesses (51%) do not use a price waterfall. Let that sink in. A price waterfall is the most fundamental roadmap for tracking every discount, rebate, and fee that bleeds value from a product’s list price down to the final pocket price. Without it, leaders are effectively blind; they can’t see the very leaks that turn a promising SKU into a financial drain.

This blindness is compounded by a systemic reliance on outdated assumptions. The RGA data reveals that the vast majority of companies are guess‑pricing: over 75 % still use archaic “cost‑plus” or subjective pricing methods that ignore the true variable costs of marketing, fulfillment, and returns. Even worse, 63 % of companies cannot quantify promotion ROI, and nearly 70 % of commercial teams don’t know their marketing‑spend ROI at all.
That is the essence of the Portfolio Trap—celebrating high‑volume SKUs whose untracked discounts, rebates, and service costs quietly erode the bottom line.
The SKU Profitability Black Hole
The core problem is that most businesses are flying blind at SKU level. Leaders glance at a P&L, see a reasonable gross‑margin average, and stop there. They miss the in‑portfolio variance—“hero” SKUs earning 60 % margin beside “zombie” SKUs draining –10 %. According to the same 2022 study, inadequate category insight means many category teams “react to sales requests and supplier priorities rather than shape their assortment.”
Deconstructing the Portfolio Trap
The Trap is a cascade of issues created by poor visibility:
- The High‑Volume Illusion – High revenue ≠ high profit when variable costs remain hidden.
- The Mix‑Management Blind Spot – Over time, sales migrate toward lower‑margin SKUs without anyone noticing.
The 2022 distribution study lays out three pillars for escaping this trap:
| Pillar | What the Study Highlights | Why It Matters Here |
|---|---|---|
| Re-imagine the Category-Manager Role | Treat the category owner as a P&L “chief strategy officer” with a 360° view of pricing, supply, and customer needs. | Someone must own—and continuously correct—SKU-level profitability. |
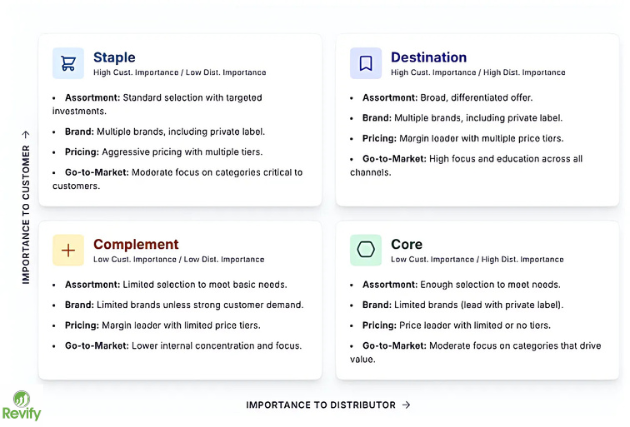
| Reset Category Strategy | Classify items into Destination, Core, Staple, Complement segments and align assortment, pricing, and brand tactics accordingly. | Segmentation exposes “profit vampires” and clarifies which SKUs deserve investment or retirement. |
| Link Strategy to Core Value Levers | Systematically pull five levers: assortment mix, private-label expansion, supplier engagement, supply-chain performance, and sales enablement. | These levers mirror the very cost and mix drains we diagnose. |


