

Case Studies

Explore real-world case studies from Revify Analytics. See how our RGM and pricing optimization solutions help distributors and manufacturers drive growth, improve margins, and reduce churn.

Digital data analytics with predictive growth graphs and data streams.

How Do Mid-Market Pricing Teams Deploy Predictive and Prescriptive Analytics?

Predictive and prescriptive pricing analytics for mid-market manufacturers and distributors combines Double Machine Learning elasticity, association-rule cross-sell, and RFM customer segmentation—delivered as a managed service rather than an internal data-science build. The result is enterprise-grade decision quality, monthly model refreshes, and statistically grounded pricing without a seven-figure platform investment.

Read More »
Digital data refinery process illustrating data transformation and quality checks.

How Do You Engineer a Trustworthy Data Foundation for Pricing Analytics?

Engineering a trustworthy data foundation across 1.3M manufacturer transactions lifted data health from Good to Excellent by correcting 27,000+ negative-cost rows, orphaned costs, and date misalignments. A clean foundation is the prerequisite for elasticity, market-basket, and RFM analytics—without it, even sophisticated models produce results leadership refuses to act on.

Read More »
Digital visualization of $10MM in product affinity insights for manufacturers.

How Does Product Affinity Analysis Uncover Hidden Cross-Sell? A $10MM Case Study

Product affinity analytics uncovered $10MM in hidden cross-sell at a mid-market manufacturer by applying machine-learning association rules across the full transaction history. Statistically significant co-purchase patterns (filtered by Support, Confidence, and Lift) translate into a customer-level gap analysis that prices every missing SKU at the customer’s own negotiated economics.

Read More »
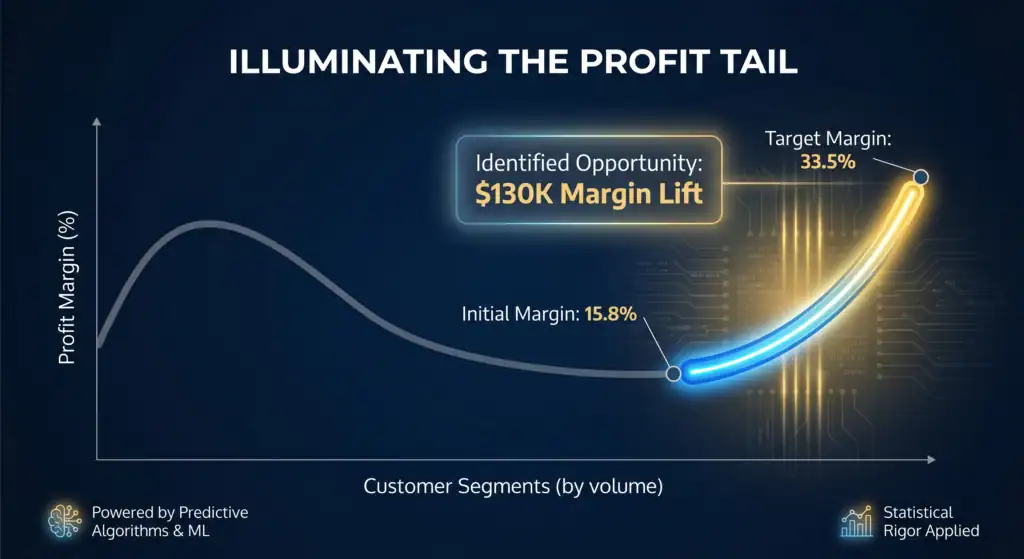
Graph showing $130K margin lift by optimizing customer segments and profit tail.

How Do You Repair a Customer Portfolio Tail Without Losing Volume?

Repairing the customer portfolio tail recovered $130K in annualized margin for a manufacturer—without volume loss—by isolating 100 break-even and 252 low-GM accounts, then applying elasticity-aware pricing moves cross-referenced against ML customer segmentation. The result distinguishes genuinely unprofitable accounts from strategic ones, making tail monitoring a permanent monthly commercial discipline.

Read More »
Visual of layered discount matrix for pricing strategy optimization.

How Do You Redesign Pricing Architecture From Discount Chaos to Disciplined Tiers?

A redesigned pricing architecture replaced a manufacturer’s legacy discount stack with a clean Bronze-Silver-Gold-Platinum tier structure, assigning every customer to one strategic discount based on RFM segmentation and price elasticity. The new architecture collapsed thousands of unused discount combinations into a governable, self-correcting system where tiers are earned by buying behavior.

Read More »
Business analytics showing margin protection through data analysis and category strategy.

How Does Price-Cost Discipline at the Category Level Protect Mid-Market Margin?

Price-cost discipline and category-level strategy protected $1.6MM of margin at a mid-market manufacturer by exposing divergence in the largest product category before it compounded. Applying same-customer/same-SKU analysis eliminated mix contamination and surfaced the true pricing signal—proving aggregate price-cost monitoring is insufficient without category-level visibility and monthly commercial review.

Read More »
AI-driven diagnostic engine analyzing 3.56M transactions for data health.

What Is a Data Health Check and How Does It Build the AI Analytical Foundation?

A rigorous data health check scored 93.17 across 3.56M distributor transactions, establishing the AI-ready foundation required before any pricing or RGM analytics can be trusted. The five-dimension methodology evaluates completeness, accuracy, consistency, timeliness, and matrix conformance—giving leaders a single defensible number for the dataset feeding every downstream commercial decision.

Read More »
Visual representation of digital pipeline for cross-selling insights.

How Does Association-Rule Mining Turn Purchase Patterns Into Cross-Sell Pipeline?

Association-rule mining of distributor purchase patterns surfaced $1MM+ in cross-sell opportunity by comparing every customer basket to high-confidence co-purchase rules and flagging every missing SKU. Each gap becomes a sized, customer-specific conversation priced at negotiated economics—turning cross-sell from a one-off report into a continuously refreshed pipeline for sales reps.

Read More »
Visual analytics dashboard showing customer retention and revenue recovery metrics.

How Does RFM-Based Customer Retention Recover At-Risk Sales?

Customer retention analytics, driven by RFM segmentation, recovered $1.5MM–$3MM in at-risk Showroom sales at a mid-market distributor by flagging churn risk before revenue hardened into loss. Scoring accounts by recency, frequency, and monetary value mapped them into actionable Champions, At Risk, and Cannot Lose Them segments for predictive, segment-led engagement.

Read More »
Digital analytics dashboard showing profit growth and customer SKU visibility.

How Do You Turn Loss-Making Customers Into a 15% Gross Margin Lift?

An elasticity-driven playbook produced a 15% gross margin lift on chronically loss-making customer-SKUs at a mid-market distributor without unacceptable volume loss. The approach isolates bottom-of-book accounts, simulates moves with price elasticity evidence, and segments customers into recoverable versus structural loss leaders—converting roughly $6MM of sub-5% GM sales into recovered margin.

Read More »
How Do You Reclaim Lost Price Realization at a Mid-Market Distributor? — Reclaiming $1.7MM in Lost Price Realization (image…

How Do You Reclaim Lost Price Realization at a Mid-Market Distributor?

A mid-market distributor reclaimed $1.7MM in lost price realization over twelve months by combining same-customer/same-SKU decomposition, a refreshed discount waterfall, and disciplined monthly price-cost governance. Reversing the ($140K) monthly YoY headwind required treating price realization not as a single-lever fix but as a compounding capability with executive-visible controls.

Read More »

Browse Top Contents

Get in Touch With Us!

Let’s Unlock Your Profitable Growth Potential

You are on the right spot!

We are still working on this to give the best insights. 

We will inform you once this is done.