


Customer profitability analysis for manufacturers and distributors: identify which customers to retain, improve, or discontinue.
By Enrico Sieni · Revify Analytics · 2026-08-14 · ~14 min read
Table of Contents
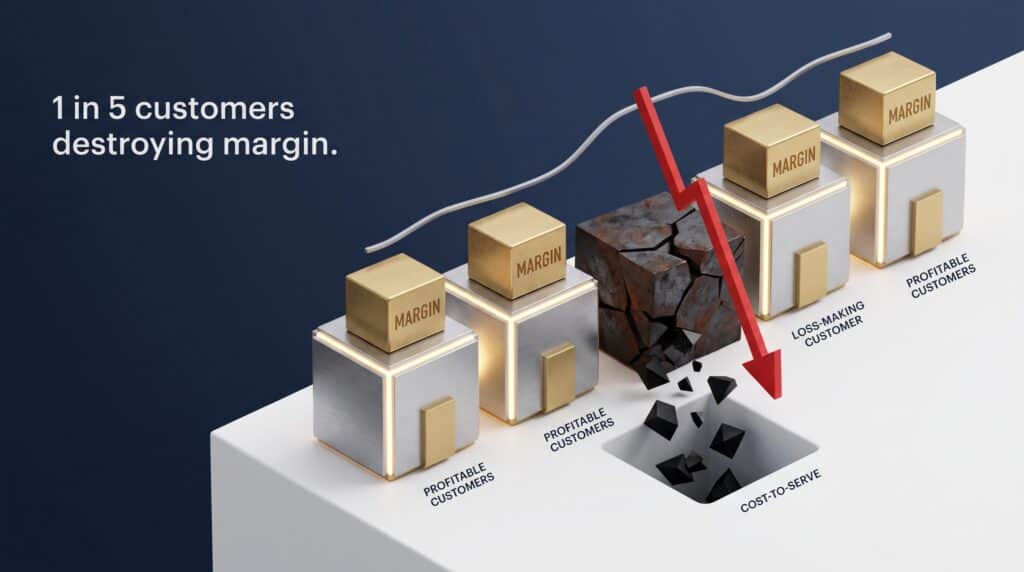
Summary: In the 24-account sample provided with the free template, five customers become unprofitable after accounting for cost-to-serve. This represents one in five accounts. These customers account for 8.6 percent of invoice revenue and return $101,022, or 14 percent of the profit generated by the remaining accounts.
Kaplan and Narayanan measured the same pattern in 2001: the least profitable 10 to 20 percent of customers account for 50 to 200 percent of total profits.
A customer profitability analysis identifies which accounts fall into this group and outlines the appropriate actions for each. This article provides a seven-step process, all necessary formulas, and clear criteria for retaining, improving, or discontinuing customer relationships.
Distributors can quickly name their five largest customers, but often hesitate when asked to identify their five least profitable accounts.
That pause is the whole problem, and it is expensive. In the sample book we published with this article, the five loss-making accounts look completely ordinary on the revenue report. One of them is the twelfth-largest customer in the business. Another sits seventh by revenue and seventeenth by profit. Nobody would have picked them out, because nobody had ever added up what serving them costs.
Customer profitability analysis quantifies the total cost to serve each account.
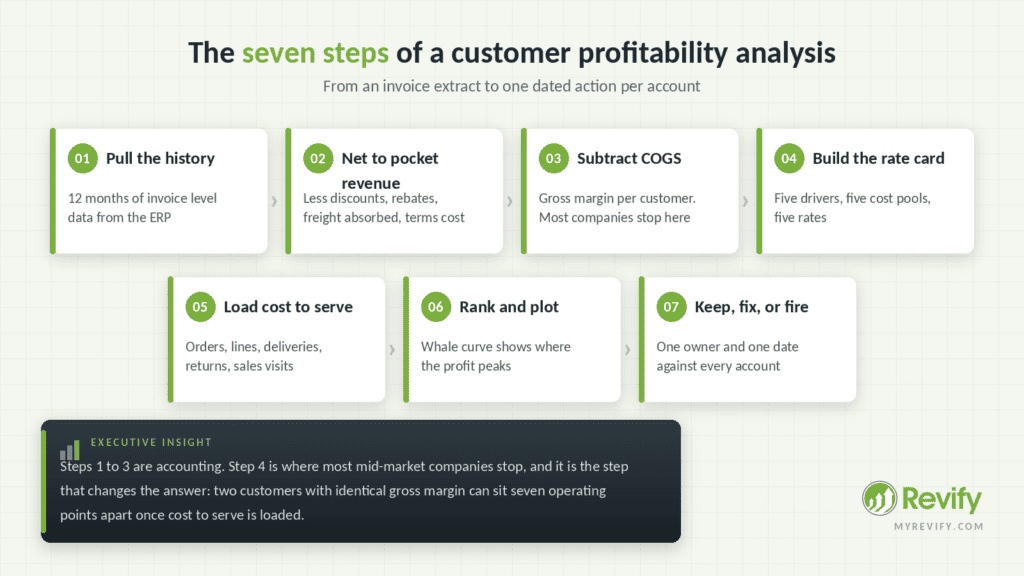
Alt text: Seven-step method for a customer profitability analysis, from invoice extract to a dated action per account
What is customer profitability analysis, and why does revenue hide the truth?
Customer profitability analysis calculates the actual profit each customer generates after deducting all discounts, rebates, freight charges, and service costs. It answers a key question not visible on the invoice: after all efforts to acquire, serve, deliver to, and collect from a customer, what profit remains?
For example, a flagship customer invoices $1,000,000 annually with a 21.3 percent gross margin. After accounting for 520 orders, 310 deliveries, and 65 returns, the true operating margin drops to 12.9 percent. In contrast, a smaller account purchasing the same products via EDI achieves a 20.1 percent margin. Both operate under the same business and price list, yet their operating margins differ by seven points.
Revenue can be misleading due to structural factors. Invoice revenue reflects what is charged, not what is retained. Deductions such as off-invoice discounts, rebate accruals, absorbed freight, and the carrying cost of delayed payments reduce actual returns. Additionally, below gross margin, further costs include order processing, picking, deliveries, returns, and untracked sales visits.
Investing time in this analysis is worthwhile. Price is the most influential factor in profitability, yet it is often eroded unintentionally. Revify’s analysis of over 2,000 public companies found that a 1 percent increase in net price raises operating profit by a median of 6.4 percent. Customer profitability analysis reveals which customers are quietly offsetting these gains.
Why do your biggest customers often earn you the least?
This occurs because both size and cost increase together, but only revenue is visible in standard reports. This insight often has the greatest impact during analysis.
Large accounts negotiate for deeper discounts and higher rebate tiers. They place frequent, smaller orders, request dedicated delivery windows, return more products, and require additional sales visits. While these behaviors are rational for the customer, they increase your costs and are not reflected on the invoice.
Robert Kaplan and V.G. Narayanan put a number on this in 2001. Writing in Cost Management, they reported that the cumulative profitability curve typically shows the most profitable 20 percent of customers generating between 150 and 300 percent of total profits, the middle 70 percent breaking even, and the least profitable 10 percent losing between 50 and 200 percent of total profits.
Kaplan later described one company in Harvard Business School’s Working Knowledge series in which the most profitable 40 percent of customers generated 130 percent of annual profits, the middle 55 percent broke even, and the least profitable 5 percent incurred losses equal to 30 percent of annual profits. His broader observation is blunter: in many companies, 15 to 20 percent of customers generate 100 percent or more of the profits.
That is the pattern practitioners call the whale curve, and it is the reason a customer profitability analysis usually surprises the people who commission it. It is also the same logic we apply to the product axis in the SKU rationalization playbook: the tail is not small, and it is not free.
What data do you need before you start?
A customer profitability analysis requires twelve months of detailed invoice-level data, not summaries or customer master records.
From the ERP, pull the following: customer number and name, invoice number and date, product or SKU, quantity, invoice revenue, discount amount, rebate accrual, freight billed and freight paid, and cost of goods. From the CRM or the delivery system, pull the driver volumes: order count, order line count, delivery count, returns count, and sales visits.
If your systems do not track rebate accruals and absorbed freight at the customer level, proceed regardless. This gap is itself a key finding. The 2025 Revenue Growth Analytics Maturity Report found that 50.7 percent of companies lack a price waterfall, meaning the connection from list price to realized revenue is missing. Begin with available data, document any gaps, and address data improvements as a secondary project.
How do you calculate customer profitability?
There are four straightforward calculations. The challenge lies in applying them to every account, not just the top ten, which is where many analyses fail.
Net every customer down to pocket price
Pocket revenue = invoice revenue – discounts – rebates – freight absorbed – payment terms cost
Pocket revenue is the amount retained after all deductions. For the flagship account in the sample: $1,000,000 invoiced, minus $90,000 in discounts, $30,000 in rebates, $24,000 in absorbed freight, and $11,000 in carrying costs for delayed payment. Pocket revenue totals $845,000, meaning the account returned 15.5 percent of its invoice value before any goods were shipped.
Payment terms cost is often overlooked. It is calculated as invoice revenue multiplied by average days to pay, divided by 365, and then multiplied by your cost of capital. For example, $500,000 at 45 days and 9 percent results in $5,548. While small per account, this cost is high across the entire customer base.
If the netting step is new to you, our guide to true net price walks the full waterfall, and the rebate management playbook covers the accrual side, which is where most of the disputed numbers live.
Alt text: Waterfall showing one customer netted from $1,000,000 invoiced to $845,000 pocket revenue and $108,585 of operating profit after cost to serve
Build the five-driver cost-to-serve rate card
Cost to serve = (orders × order rate) + (lines × line rate) + (deliveries × delivery rate) + (returns × return rate) + (visits × visit rate)
These five drivers capture the most relevant costs in distribution or light manufacturing. Assign each operating expense below gross margin to a single driver, then divide by the annual volume for that driver to determine the rate.
The template’s sample rate card runs $42.00 per order, $3.10 per order line, $65.00 per delivery, $95.00 per return, and $310.00 per sales visit. Those are illustrative figures built so that the worked example traces, not benchmarks to copy. Your warehouse, your fleet, your wage rates.
Exclude costs that do not vary with customer behavior. Executive salaries and corporate rent should be allocated separately, as distributing them across accounts can distort profitability and provide little actionable insight.
Avoid overemphasizing precision. Companies sometimes spend months perfecting a rate card, only to find the business mix has changed and the results are no longer trusted. An approximate rate available now is more valuable for decision-making than a perfect rate delivered too late.
How do you build a customer profitability analysis in Excel?
The free template provided includes five tabs: Customer P&L Input (netting and driver volumes), Activity Rates (cost pools and rates), Ranking and Whale Curve (output sorting), Keep-Fix-Fire Tiers (assignment of actions), and How to Use (instructions for future users).
Then two more lines of arithmetic:
Customer operating profit = gross margin – cost to serve
Operating margin % = customer operating profit ÷ pocket revenue
Run the flagship account through: $845,000 pocket revenue less $665,000 of cost of goods leaves $180,000 of gross margin, or 21.3 percent. Then load 520 orders, 3,900 order lines, 310 deliveries, 65 returns, and 36 sales visits at the rates above. Cost to serve: $71,415. Customer operating profit: $108,585, or 12.9 percent.
Now the same arithmetic on a mid-size account that buys over EDI: $310,000 invoiced, $296,050 pocket, $228,000 of cost of goods, $68,050 of gross margin at 23.0 percent. Its cost to serve, across 48 orders, 610 lines, 48 deliveries, 3 returns, and 4 visits, is $8,552. Operating profit: $59,498, or 20.1 percent.
The flagship account invoices 3.2 times more than the EDI account and generates 1.8 times the profit. However, per dollar of pocket revenue, it returns 12.9 cents compared to 20.1 cents for the EDI account. This difference is not apparent at the gross margin level, where the accounts are separated by less than two percentage points.
How do you rank customers once the math is done?
The result of a customer profitability analysis is a ranked list. Sort customers by operating profit, from highest to lowest, and plot the cumulative total. The curve rises sharply with top accounts, levels off in the middle, peaks, and then declines as unprofitable accounts are included.
That peak is the number to look at. In the template’s 24 account sample, the curve reaches $722,393 before turning, compared with the $621,371 in profit the business actually books. The peak is 116 percent of the real number. Five accounts, holding 8.6 percent of invoice revenue, hand back $101,022.
Alt text: Whale curve of cumulative operating profit across 24 ranked accounts, peaking at 116 percent of booked profit before the tail pulls it back
Changes in ranking are as informative as the curve itself. In the sample, the seventh-largest account by revenue ranks seventeenth in profitability, while the twelfth-largest is the least profitable. Conversely, the low-touch EDI account moves from eighth by revenue to fifth by profit.
In practice, these shifts often surprise commercial teams and involve accounts that have been protected for years.
| Rank by revenue | Rank by profit | Operating margin | |
| Regional OEM account | 2 | 1 | 18.0% |
| Flagship account | 1 | 2 | 12.9% |
| Low-touch EDI account | 8 | 5 | 20.1% |
| High-frequency parts account | 7 | 17 | 2.1% |
| Small-order tail account | 12 | 24 | -16.4% |
Which customers do you keep, fix, or fire?
A customer profitability analysis is valuable only if it leads to actionable decisions. Establish two thresholds, apply them consistently to all accounts, and allow the resulting tiers to guide actions.
| Tier | Profile | The move | First action |
| Keep | At or above your target operating margin. Low touch, pays on time, buys in full lines | Protect it. Annual price review and nothing else | Tell the account manager which accounts these are, in writing |
| Fix | Between zero and target. Healthy gross margin, expensive to serve | Reprice at renewal, set order minimums, reset the service model | Model the fix before the conversation |
| Fire | Below zero after cost to serve, and still below after a fix is modelled | Move to list price and standard terms, or hand to a distributor | Change the terms and let the customer choose |
Thresholds should be set as a policy decision rather than a calculation. A 15 percent operating margin is a reasonable starting point for distributors, though teams often debate the exact figure. The key is to select a defensible threshold, document it, and apply it uniformly. The primary risk is inconsistency, not minor inaccuracies in the threshold itself.
Prioritize corrective actions: adjust pricing, restructure terms, or modify the service model.
Most of the tail is fixable. Take the flagship account, which came in at 12.9 percent. Four moves, all modeled before anyone picks up a phone:
- A 2-point price increase at renewal: +$16,900, routed through a proper price increase process rather than an email
- Order minimums that consolidate 520 orders into 350: -$7,140 of cost to serve
- Scheduled delivery that takes 310 drops to 230: -$5,200
- A returns fix on the two SKUs causing most of the 65 returns, down to 40: -$2,375
The revised cost to serve is $56,700, resulting in an operating profit of $140,200 on $861,900 of pocket revenue, or 16.3 percent. This represents a $31,615 improvement, or a 29 percent increase, achieved without volume loss or impact on relationships. Three of the four changes are operational; only one involves pricing.
Maintaining discipline in discounting is essential. The same maturity study found that 61 percent of companies still manage discounts manually and inconsistently, allowing outdated discounts to persist. If the issue is structural rather than isolated, refer to the wholesale pricing tiers guide for best practices.
When firing is right, and how to exit without burning the channel
Discontinuing a customer relationship should be a last resort and is rarely initiated through direct communication.
Adjust commercial terms and allow the customer to respond. This may include moving them to list pricing, charging freight for orders below a minimum value, applying small-order fees, or reducing visit frequency. Some customers will accept the new terms and become profitable, while others may leave, shifting their volume to competitors who will face similar economics.
Follow two key rules: never exit an account without assessing its broader impact, as a loss-making account may support profitable operations elsewhere. Additionally, document every exception. In the sample, one loss-making account is retained due to a signed three-year agreement with a planned ramp-up. Defensible exceptions should be recorded; undocumented exceptions perpetuate unprofitable accounts.
Alt text: Keep, fix, or fire decision matrix showing the profile, the move, and the first action for each tier
How often should you rerun the analysis?
Run the customer profitability analysis quarterly, with event triggers in between.
Cost movement is the trigger that matters most right now. The Bureau of Labor Statistics reported that producer prices for final demand rose 4.7 percent over the 12 months ended July 2026. A customer whose pricing and service terms were set before that move and never revisited is not a neutral account. It is a standing discount that grows every quarter you leave it alone.
The other triggers: a tariff change, a freight contract renewal, a customer changing its order pattern, and any acquisition that adds a book of accounts nobody has costed. Rerun on any of those. The full analysis takes days the first time and hours after that, because the rate card is already built.
Should the model live in Excel, BI, the ERP, or with a managed service?
| Option | Good for | Breaks down when |
| Spreadsheet template | Getting the first answer in a week; up to a few hundred accounts | The refresh depends on one person who knows where the formulas live |
| BI tool | Refreshing automatically once the logic is agreed | Nobody has agreed the logic, so it visualizes the wrong allocation forever |
| ERP profitability module | Tying to the ledger; large account counts | Configuration takes months and rebates and absorbed freight still sit outside it |
| Managed service | Teams with no analyst; getting the decisions made, not just the report | You want the capability in house long-term rather than the outcome |
For most mid-market manufacturers and distributors, the first customer profitability analysis should be conducted in a spreadsheet. The analysis itself is straightforward; the greater challenge is ensuring commercial team engagement, which cannot be solved by software alone.
What mistakes should you avoid?
- Mistaking revenue rank for value rank. Net price and cost to serve often reorder the list significantly. In the sample, one account shifted ten places, another twelve.
- Stopping at gross margin. Two customers with near-identical gross margins sat seven operating points apart in the example above, and only a customer profitability analysis surfaces the gap.
- Beginning with an exit list. Most unprofitable accounts can be improved; exiting should be the final option, not the initial step.
- Delaying for perfect cost data. A five-driver rate card developed quickly captures most relevant information. More detailed ABC projects may take much longer and risk becoming outdated.
- Conducting the analysis only once. Customer mix, costs, and behaviors change over time. Treat customer profitability analysis as a recurring quarterly process to maintain accurate tiers.
- Allocating costs that do not vary with the customer. Corporate overhead spread evenly across accounts makes every customer look marginal, which is worse than useless because it is confidently wrong.
Frequently asked questions
What is customer profitability analysis?
It is the practice of calculating each customer’s true profit after subtracting discounts, rebates, absorbed freight, payment terms cost, cost of goods, and the operating cost of serving that account. The output is a ranked list of customers by operating profit, which almost never matches the ranking by revenue.
How do you calculate customer profitability?
A customer profitability analysis works in four steps. Net invoice revenue is down to pocket revenue by subtracting discounts, rebates, freight absorbed, and payment terms cost. Subtract the cost of goods to get gross margin. Then subtract the cost to serve, calculated as driver volumes times activity rates. What remains is customer operating profit. Divide it by pocket revenue to get the the operating margin percentage.
What is cost-to-serve, and how do you allocate it without ABC software?
Cost to serve is the operating cost of servicing an account: order processing, picking, delivery, returns, and sales coverage. You allocate it with a five-driver rate card. Take the relevant expense pools from the general ledger, divide each by its annual driver volume, and multiply the resulting rate by each customer’s volume. No software required.
What is the whale curve in customer profitability?
It is the cumulative profit curve you get when you rank customers from most to least profitable and plot the running total. It climbs, peaks above 100 percent of the profit the business actually books, then falls as loss-making accounts are subtracted. Kaplan and Narayanan found that the peak typically sits between 150 and 300 percent of total profits. The gap between the peak and the end point is what the unprofitable tail costs you.
Should you ever fire a customer?
Rarely, and never as a first move. Most unprofitable accounts become profitable with order minimums, delivery consolidation, and a price correction. Reserve exit for accounts that stay below zero after a fix has been modeled, and execute it by changing terms rather than by ending the relationship, so the customer chooses.
The principle underneath all of it
You cannot manage a number you have never calculated, and most mid-market manufacturers and distributors have never calculated this one. Not through negligence. Because the ledger is organized by product and period, and profit is created or destroyed by customer and by behavior, and no standard report crosses those two axes.
A customer profitability analysis bridges these dimensions. Its output is not just a report, but a list of customers, each with a profit figure, recommended action, timeline, and responsible owner. The most successful businesses are those that act on this list, not necessarily those with the most complex allocation models.
Begin with twelve months of invoice data and the five key cost drivers. The remaining steps are straightforward calculations. For further details, refer to the margin leakage guide.
Start Your Profit Diagnostic
We conduct customer profitability analyses and subsequent pricing work for mid-market manufacturers and distributors without dedicated pricing teams. Our diagnostic provides your whale curve, rate card, and a breakdown of accounts to retain, improve, or discontinue, with the impact of each action quantified in advance. Download the free customer profitability analysis template to perform your own assessment, or begin your profit diagnostic at myrevify.com.
About the author: Enrico Sieni has over twenty years of experience in pricing and revenue growth management and has established three pricing teams. He now advises that most mid-market companies do not need to build additional teams. Effective pricing is achieved by consistently applying a few key practices: understanding true net price, knowing the cost to serve each customer, and acting on these insights. He writes weekly at myrevify.com on the operational aspects of price realization.