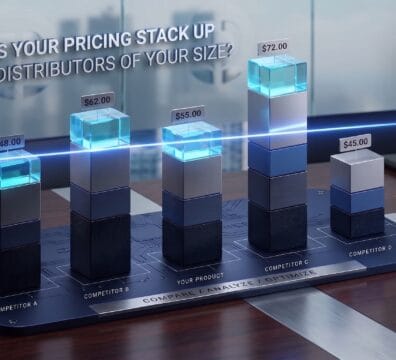



Distributor pricing benchmarks answer the one question your ERP cannot: how does my pricing compare to other distributors my size? This guide gives mid-market distributors and manufacturers six ratios to compute from an ordinary order-line extract, the public benchmark range for each one, a scoring band, and a worked example. The six are gross margin, discount depth off list, price dispersion on the same SKU, pocket price percentage, freight recovery and the share of orders that lose money. A $60M building products distributor running a 26.0% gross margin and a 3.0% net profit found about 1.9 points of net margin inside those six numbers. Nothing here needs pricing software or a pricing hire.
Table of Contents
What are distributor pricing benchmarks, and why can your ERP not show them?
Distributor pricing benchmarks are ratios that describe how price is set, given away, and collected, expressed so that one company can be compared with another regardless of size. Gross margin is the only one that most companies track. It is also the least informative, because it is the end result of five decisions that the ERP never reports on its own.
An ERP reports the invoiced gross margin by SKU, customer, and rep. It does not show how far the invoice price is below the list price, how much the prices of the same SKUs vary across customers, how much of the list price survives rebates, freight, and terms, or how many orders lose money once the cost of processing them is factored in. The 2025 Revenue Growth Analytics Maturity Report found that 50.7% of companies have no price waterfall at all, and the waterfall report would reflect this.
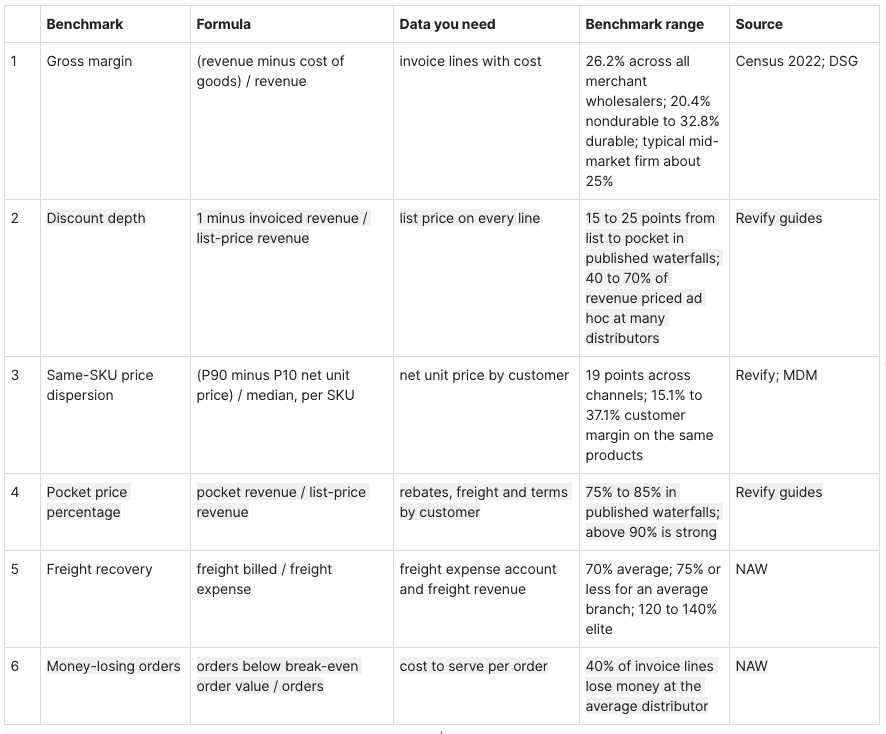
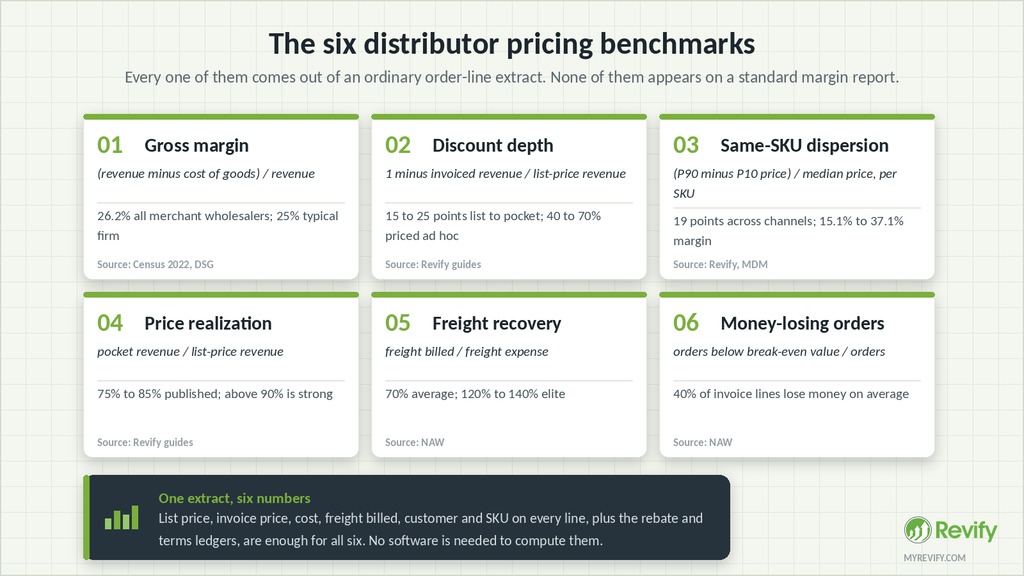
The six distributor pricing benchmarks below cover the whole path from list price to net profit. Each has a formula, a place where the data lives in the ERP, a benchmark range from a public or Revify source, and a scoring band later in the guide.
Distributor pricing benchmarks versus financial benchmarks
Pricing benchmarks for distributors come in two families. A bank, an association PAR report, or a risk-ratio study compares companies on P&L ratios: gross margin, operating expense, net profit, and inventory turns. Those are useful, and savvy financial people monitor them closely. But they compare outcomes. On the flip side, distributor pricing benchmarks help clarify decisions: what the sales force did to list price, what finance gave back after the invoice, what operations charged for freight, and what an order minimum let through. You need both sets. Only the second one tells you which behaviors to start addressing.
What is a normal gross margin for a distributor?
Gross margin is the first of the six distributor pricing benchmarks, and the best public answer is the U.S. Census Bureau’s 2022 Economic Census gross margin profile for merchant wholesalers. Across every merchant wholesaler in the country, gross margin was 26.2% of sales. Durable goods distributors averaged 32.8%. Nondurable goods distributors averaged 20.4%. The spread by vertical is wide, which is why the all-industry figure is the wrong number to compare yourself with.
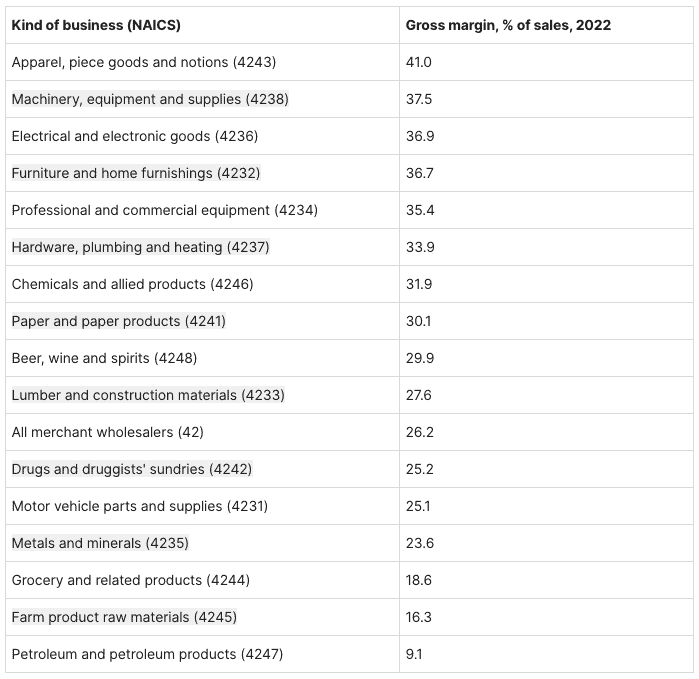
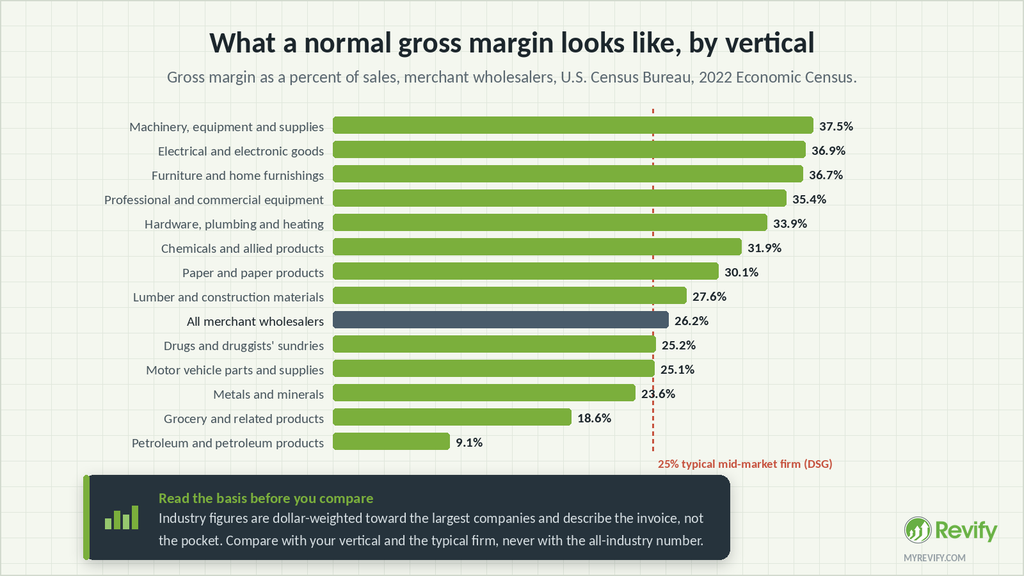
Two cautions before you compare. First, these are dollar-weighted. A vertical’s figure is pulled toward its largest companies, and the largest companies in machinery or electrical distribution carry service revenue and private-label lines that a $40M distributor does not. Second, they describe the invoice, not the pocket. Nothing in a Census gross margin tells you what went back to the customer after the invoice was cut.
For the typical mid-market firm, Distribution Strategy Group’s long-running profile is the better yardstick: on $50M of sales, 25% gross margin, 22% operating expenses, and 3% net profit. NAW puts the average distributor’s EBITDA at 4% of sales and elite distributors at 8% to 12%. So a 26% gross margin is normal, and a 3% net profit is normal. Gross margin does not distinguish between normal and elite. The five numbers below do.
One arithmetic trap lives inside this table. Distributors that price cost-plus talk in terms of markup and read benchmarks in terms of margin. A 30% markup is a 23.1% margin (0.30 / 1.30). A company that marks up by 30% and compares itself to the 26.2% Census figure is already 3 points behind before a single discount is applied. The cost-plus pricing guide covers the rest of that trap.
How deep do distributors discount off list, and how do you measure it?
Discount depth is the gap between the list price and the invoice price, measured across all lines for a year. It is the second of the distributor pricing benchmarks, and the first one the ERP can compute in a single query, because most systems store a list price on every line, even when nobody sells at it.
Formula. Discount depth = 1 minus invoiced revenue / list-price revenue. In the worked example: 1 minus $60.0M / $70.0M = 14.3%.
Two companion numbers matter more than the discount depth figure itself. Override share is the share of revenue on lines where a seller keyed a price below what the pricing matrix would have produced. Override margin gap is the margin difference between those lines and the lines that the matrix priced. In the worked example, the override share was 31%, and the override lines earned 9.5 points less margin than matrix-priced lines.
There is no public median for discount depth, and anyone who quotes one is guessing. What the waterfalls Revify has published do show is list-to-pocket leakage of 15 to 25 points, and in the matrix pricing guide’s composite, 40% to 70% of revenue was priced through ad hoc decisions, with override lines earning roughly 1,000 basis points less than system-priced lines. The 2025 maturity report’s finding that 61% of companies still rely on manual, inconsistent discounting processes is the same fact seen from the other side.
The benchmark that matters is therefore internal. If the override share is above 40% of revenue, the matrix is decorative. If the override margin gap is above 5 points, sellers are not pricing to a floor. Both are fixed with rules rather than with a price increase, and the tier design guide shows what the rules look like.
How wide is price dispersion on the same SKU, and what is normal?
Price dispersion is how far apart your own prices sit for the same item across customers. It is the most honest of the distributor pricing benchmarks because it compares your best decision with your worst on the same product, without needing a peer group.
Formula. Same-SKU price band = (P90 net unit price minus P10 net unit price) / median net unit price, computed per SKU across customers, then read as the median band across your top 200 SKUs by revenue. Worked example: 22%.
The published reference points line up. In the channel pricing guide, one distributor sold the same SKU through direct accounts, a dealer network, and a national chain, and the pocket prices sat 19 points apart. In the matrix pricing guide, one item carried a $12.40 list price, a $10.17 tier price, a $10.00 floor, and a $9.15 customer-specific fixed price: 26% between the top and the bottom of one SKU. Randy MacLean’s analysis in Modern Distribution Management found one distributor’s customers earning between 15.1% and 37.1% margin on the same products. Revology’s engagement data show that pocket margins on comparable accounts can differ by up to 600 basis points,, depending solely on which rep owns them.
A band under 10% for your top SKUs means the matrix is handling pricing. A band over 20% means relationships are. The customer profitability guide shows where the bottom of the band usually sits: the flagship account with the lowest price and the highest cost to serve, earning a 12.9% operating margin, compared with 20.1% for a smaller account buying the same products.
What pocket price percentage should a distributor expect?
Pocket price percentage is the share of the list price that reaches the bank after everything given back on and off the invoice: pocket revenue divided by list-price revenue. It is the fourth of the distributor pricing benchmarks and the one that converts most directly into profit. It is often labeled price realization, but that is a different measure. Price realization is the net price change divided by the list price change, so a 5% list price increase that raises net price by 3% is 60% realization. Pocket price percentage tells you how much of the list price you keep; price realization tells you how much of an increase you keep.
Formula. Pocket price percentage = pocket revenue / list-price revenue, where pocket revenue = invoiced revenue minus rebates minus unrecovered freight minus cash discounts and terms. Worked example: $57.105M / $70.0M = 81.6%.
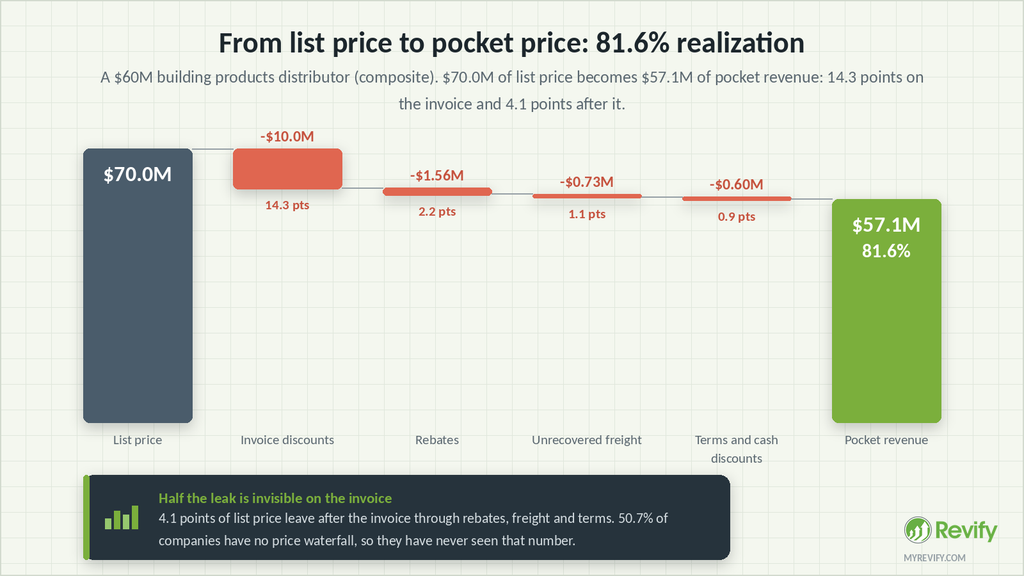
The two waterfalls Revify has published come out at 85% (a $100 list price reaching $85 after an on-invoice discount, a promotional rebate, freight absorption, and extended terms) and 75% (a $100 list price reaching $75 after a standard discount, a negotiated discount, a volume rebate, freight, and early-payment terms). Above 90% is strong for a distributor with a real rebate program. Below 75% means the list price no longer means anything.
What moves it is documented in the price realization guide and its companions: a distributor lifted its pocket price percentage 2.3 points in two quarters by cutting dealer discount variance roughly in half and exception volume by two-thirds; a med-tech manufacturer added about 5 points; first-month gains typically fall between 1 and 5 points. Every point is 1% of revenue, and at a 3% net margin, that is a third of net profit.
How much freight should you be recovering?
Freight recovery is the share of your freight bill that customers paid. Of the six distributor pricing benchmarks, it has the clearest public reference, and it is usually the fastest to move.
Formula.Freight recovery = freight billed to customers / freight expense. Worked example: $1.365M / $2.1M = 65.0%.
NAW’s freight recovery series sets the range. Freight has historically run 2% to 5% of distributor revenue, and NAW expects it to double toward 4% to 10%. On average, only 70% of freight costs are recaptured from customers. An average branch recovers 75% or less. Elite distributors recover 120% to 140% of the targeted freight cost because freight terms are priced rather than absorbed. Under-recovery alone can cost 60 to 150 basis points of net margin, which for a 3% net distributor is 20% to 50% of the bottom line.
The cost side is not standing still. The BLS producer price index for final demand transportation and warehousing services rose 2.3% in August 2026 alone, and final demand prices are up 5.4% over the twelve months to August. A freight-included threshold set in 2023 is a discount that grows every quarter, but nobody looks at it.
What share of your orders lose money?
The sixth of the distributor pricing benchmarks is the one that gross margin hides completely. An order earns gross profit per dollar and costs money per event, so below some order value, every order loses money regardless of the margin printed on the invoice.
Formula.Break-even order value = cost to serve per order / gross margin rate. $42.00 / 0.26 = $161.54. Money-losing order share = orders below break-even / total orders. Worked example: 16,320 / 48,000 = 34%.
NAW’s analysis puts the average distributor at 40% of invoice line items losing money once the cost to serve is counted against gross margin. MDM’s MacLean data goes further: distributors with 65% to 75% money-losing invoices average 2.7% net profit, while those with 0% to 15% average 22.6%. That is the widest spread in this guide, and policy produces it rather than the market. The minimum order quantity guide shows the policy: the $42.00 cost stack, the $161.54 floor, and the fee that closes the gap. The contribution margin guide shows the same effect one level down, at the SKU that prints a 38% margin and loses $0.49 a unit.
How do distributor pricing benchmarks change with company size?
The direct answer to “how does my pricing compare to other distributors of my size” is that the six ratios are scale-free. A $30M distributor and a $300M distributor face the same six numbers, and the ranges above apply to both. What size changes is the mechanism that produces each number, which is why no public dataset bands these six by revenue, and this guide does not invent one.
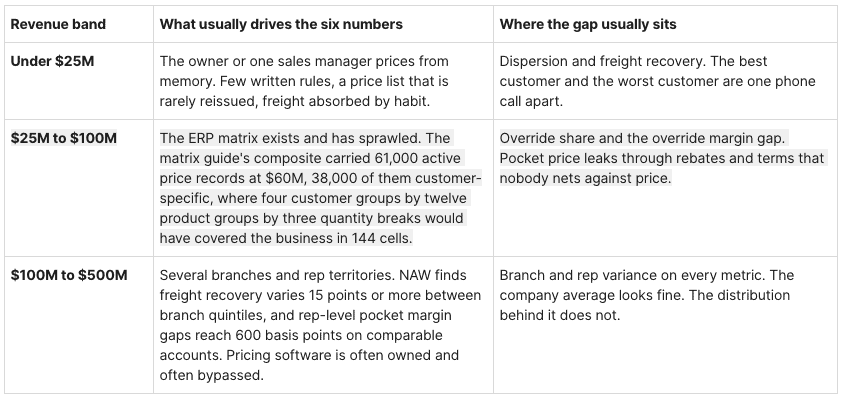
Two size effects deserve their own line. First, the dollar-weighted Census figures are higher than those for the typical firm because the largest companies pull them up. A $40M machinery distributor comparing itself with 37.5% is comparing itself with the wrong population, and the DSG 25% typical figure is the fairer read. Second, Distribution Strategy Group’s 2026 survey of 128 distributors found that 36% still lack any structured customer segmentation. Segmentation is what makes the discount and dispersion numbers governable. A company with no segments cannot have a matrix, and a company with no matrix has no overrides to measure.
What does a worked example look like?
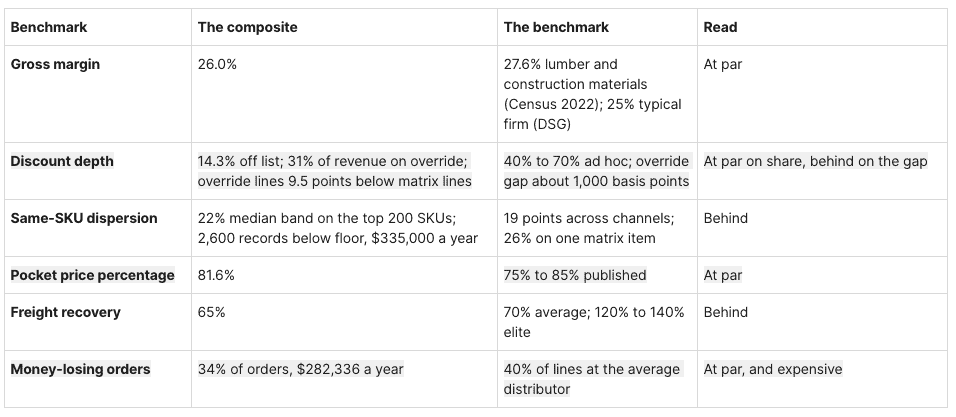
The company is a composite of mid-market building-products distributors we have worked with: about $60M in revenue across three branches, 900 active customers, 4,100 SKUs, 48,000 orders a year, and no pricing analyst. Gross margin 26.0%, operating expenses 23.0%, net profit 3.0%, which is the DSG typical shape almost exactly.
The six distributor pricing benchmarks came from a twelve-month order-line extract with list price, invoice price, cost, freight billed, customer,, and SKU on every line, plus the rebate and cash-discount ledgers and the freight expense account. Pulling it is an afternoon of work for a controller.
The pocket price percentage decomposes cleanly. List-price revenue was $70.0M. Invoice discounts took $10.0M, or 14.3 points. Rebates took $1.56M, unrecovered freight $735,000, and cash discounts and terms $600,000: another 4.1 points nobody had ever netted against price. Pocket revenue $57.105M, pocket price percentage 81.6%.
The dispersion number was the diagnostic. Of 61,000 price records, 2,600 across 180 customers sat below the 27% margin floor, carrying $6.2M in revenue at an average of 5.4 points under the the floor. That is $335,000 a year, and it is where the first point of pocket price comes from.
Then the money.
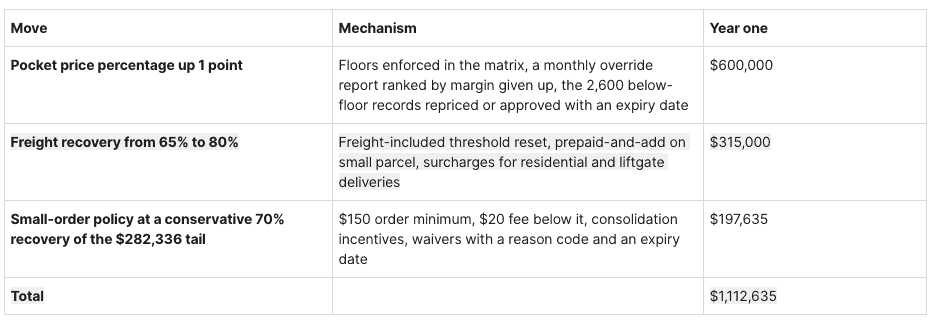
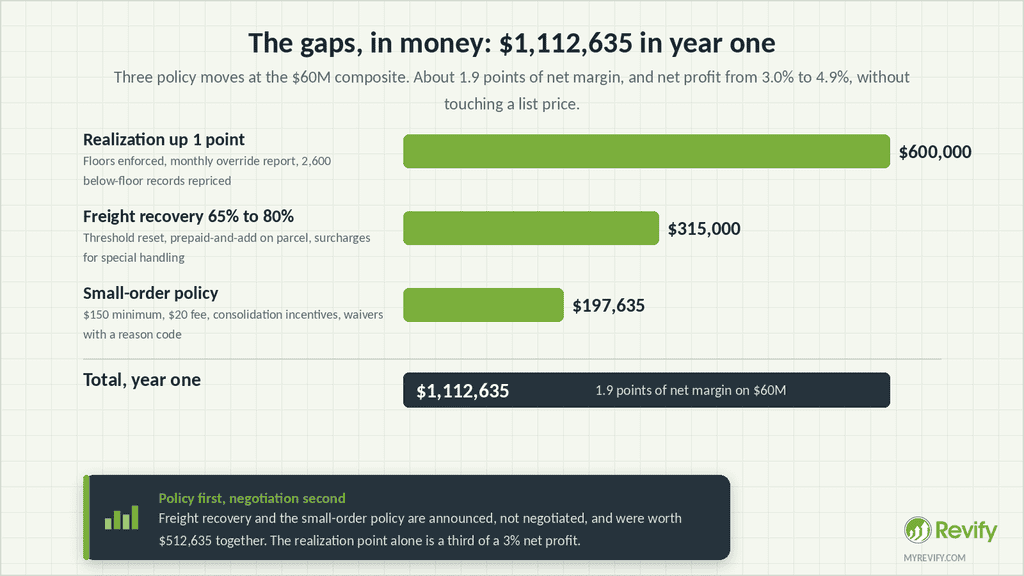
$1,112,635 on $60M is about 1.9 points of net margin. Net profit moves from 3.0% to 4.9%, a lift of roughly 62%, without hiring anyone, buying software, or taking an across-the-board increase. The one-point pocket price move alone is worth a third of net profit, which is what DSG’s 30% to 35% profit lift for a 1% price rise predicts for a 3% net distributor. Two of the three moves are policy changes that need no customer negotiation at all.
How do you score yourself, and what do you fix first?
Pull the extract, compute the six distributor pricing benchmarks, and place each one in a band. The bands are the working thresholds we use, anchored to the published figures above rather than to a survey median, because no survey median exists for four of the six.
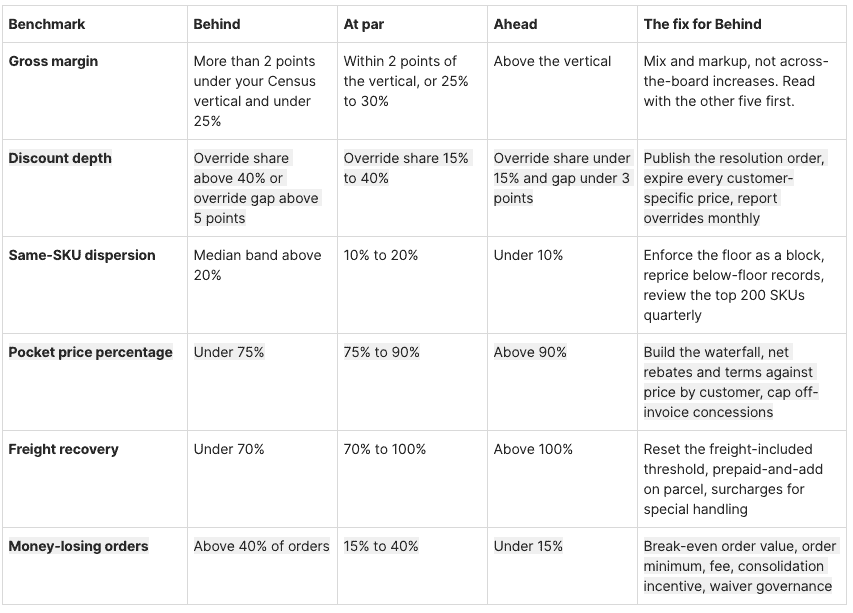
Fix them in this order. Start with freight recovery and small-order policy: both are policy changes you announce rather than negotiate, and together they were worth $512,635 in the composite. Pocket price percentage comes second, through an enforced price floor and a monthly override report. That is where customer negotiations happen, so bank the policy wins before they start. Price dispersion then narrows on its own once the floors block below-floor prices rather than just warning the rep. Discount governance and gross margin mix come last. If gross margin moves, run a price-volume-mix analysis before you take credit for it, because mix alone can move gross margin 2 points with no pricing decision behind it.
What mistakes distort a pricing benchmark?
Five mistakes come up in almost every first conversation about distributor pricing benchmarks. Each one makes a company look better or worse than it is, and each has a simple correction.
- Treating the industry gross margin as your target. Census figures are dollar-weighted across every firm in the vertical. Compare against the vertical figure, the typical firm, and your own last three years, and read the gap as context.
- Reading a higher gross margin as better pricing. One distributor’s customers earned between 15.1% and 37.1% on the same products. Gross margin hides cost to serve, and cost to serve decides net profit.
- Counting only invoice discounts. Off-invoice leakage was 4.1 points of list in the composite. Half of the companies have no waterfall, so they have never seen theirs.
- Waiting for industry data. Six ratios come out of your own order lines this week. The dispersion inside your own file is a more honest benchmark than any survey, because it is your best price against your worst.
- Expecting a benchmark to tell you what to charge. It tells you where the leak is and how big it is. The price is set by the floor, the matrix, and the customer’s alternatives.
Frequently asked questions
What is a normal gross margin for a distributor?
Across all U.S. merchant wholesalers, gross margin was 26.2% of sales in the 2022 Economic Census: 32.8% for durable goods and 20.4% for nondurable goods, ranging from 9.1% in petroleum to 37.5% in machinery, equipment, and supplies. A typical mid-market distributor runs about 25% gross margin, 22% operating expenses, and 3% net profit. Compare with your own vertical, never with the all-industry figure, and treat gross margin as one of six distributor pricing benchmarks rather than the whole story.
How much discount off list is typical for a distributor?
There is no public median. The waterfalls Revify has published run 15 to 25 points from the list to the pocket, and at many distributors, 40% to 70% of revenue is priced through ad hoc decisions rather than the matrix. Measure your own discount depth, override share, and override margin gap. A gap above 5 points between override lines and matrix-priced lines is the number to act on first.
What is a good pocket price percentage for a distributor?
Pocket price percentage is pocket revenue divided by list-price revenue. It is often called price realization, but price realization is the net price change divided by the list price change. Published distributor waterfalls range from 75% to 85%. Above 90% is strong for a company with real rebate programs. Below 75% means the list price no longer governs anything. Each point of pocket price percentage is about 1% of revenue, and nearly all of it reaches operating profit, so one point is worth about a third of net profit at a 3% net margin.
How does my pricing compare to other distributors my size?
Compare ratios, not dollars. The six distributor pricing benchmarks in this guide are scale-free, so the same ranges apply at $30M and at $300M. What changes with size is the mechanism: rule sprawl in the matrix between $25M and $100M, branch and rep variance above $100M. If you want a single number, start with the same-SKU price band for your top 200 SKUs. It is the only benchmark where the peer group is your own best decision.
Do you need pricing software to benchmark your pricing?
No. An order-line extract with list price, invoice price, cost, freight billed, customer, and SKU on every line, plus the rebate and cash-discount ledgers, is enough for all six distributor pricing benchmarks in a spreadsheet. Software earns its keep at a multi-branch scale after the six numbers are already tracked monthly and the floors are already blocked rather than warned.
The principle underneath all of it
A benchmark is only useful if it points to a decision. Gross margin points to nothing, because it is the sum of everything. The five numbers underneath it each point at one policy: a floor, a resolution order, a waterfall, a freight term, and an order minimum. That is why the composite could recover 1.9 points of net margin without touching a single list price.
The profit arithmetic is the same everywhere. Revify’s analysis of more than 2,000 public companies found that a 1% improvement in net price lifts operating profit by a median of 6.4%, and for a distributor at a 3% net margin, the lift is closer to a third. Whichever end of that range you sit at, the six distributor pricing benchmarks are where the point comes from. Pull the extract this week.
Start Your Profit Diagnostic
In a short call, we look at your own order-line extract and tell you where your six numbers sit against the ranges in this guide, which policy gap is worth the most, and what the first ninety days look like. You do not need software or a pricing hire, and there is nothing to download. If you would like one practical pricing playbook like this in your inbox every week, register for the newsletter at myrevify.com; the signup is at the bottom of the page.
About the author
Enrico Sieni has spent two decades in pricing and revenue growth management and has built three pricing teams from scratch. That experience is why he believes most mid-market manufacturers and distributors do not need one: they need the decisions a pricing team would make, installed as rules, reports, and a monthly cadence. Revify is where he does the practical side of pricing for companies that will never hire a pricing department. His work is about realization in practice rather than in theory.