


Cost-Plus Pricing for Manufacturers & Distributors: When It Works, When It Quietly Kills Your Margin
By Enrico Sieni·Revify Analytics·2026-07-12·~12 min read
| Cost-plus pricing sets a product’s selling price by adding a fixed markup percentage to its unit cost: Selling Price = Unit Cost x (1 + Markup %). It guarantees a margin on paper, and that is precisely the trap. Because it ignores what customers would pay, how fast costs move, and what it costs to serve each account, cost-plus pricing drains two to four points of gross margin a year from the mid-market manufacturers and distributors that rely on it, without anyone noticing. |
The recommendations in this guide draw on pricing work across industrial manufacturers and distributors from roughly $10 million to $1 billion in annual revenue.
Table of Contents
Cost-plus pricing is the traditional approach for most mid-market manufacturers and distributors: calculate the unit cost, add a fixed markup percentage, and quote the final price. This method ensures a margin on paper, which is the primary reason for its continued use.
The stakes are larger than the method’s simplicity suggests. Bain & Company’s analysis of B2B companies finds that a 1% improvement in realized price typically lifts operating profit by about 8%, roughly twice the impact of the same gain in volume or cost. Price is the highest-yield lever on the P&L, and cost-plus autopilot is how most companies leave it untouched.
The scale of the habit is striking. In Revify’s analysis of commercial practices, more than 75% of companies still rely on cost-plus or subjective pricing methods that ignore the true variable costs of marketing, fulfillment, and returns (see our analysis of hidden SKU profitability). Most have never tested whether their standard markup matches what customers would willingly pay.
| The pricing mental model that outlasts any method: costs determine the minimum acceptable price. Customers determine the maximum acceptable price. Competition determines where inside that range you actually land. Cost-plus pricing manages the floor and ignores the other two. |
This guide explains when cost-plus pricing is effective, outlines five ways it can erode margin, presents alternative approaches, and introduces a keep-fix-replace framework that does not require a dedicated pricing team.
What Is Cost-Plus Pricing, and Why Won’t It Die?
Cost-plus pricing remains common for several reasons. It is simple to apply across thousands of SKUs using a single spreadsheet column. The method appears fair and provides sales teams with a defensible explanation when buyers question prices (“our costs went up”). It also creates the impression that every sale is profitable, since each price is based on cost.
The main issue with cost-plus pricing is what it overlooks. It does not consider customer value, competitor pricing, or the actual cost to serve individual accounts. While it answers, “what did this product cost us?”, it does not address the more important question: “what is this product worth to this buyer, in this channel, at this time?”
Why Do Smart Companies Stay Stuck on Cost-Plus Pricing?
The continued use of cost-plus pricing is driven by structural factors that affect even highly capable teams:
- ERP systems are built around costs. Every item record carries a cost field, so a markup column is the path of least resistance.
- Sales trusts cost more than value. A cost buildup feels defensible in a negotiation; a value argument feels like an opinion.
- Finance measures margins. Monthly reporting reinforces cost-based thinking because cost is the number that finance can audit.
- Customer value is harder to quantify. Willingness to pay takes analysis; the cost file is already sitting there.
Recognizing these four factors clarifies the path to improvement. Addressing cost-plus pricing requires changing both the systems and incentives that influence pricing decisions.
The Cost-Plus Pricing Formula (and the Markup Trap)
The math itself is trivial:
| Selling Price = Unit Cost x (1 + Markup %)Gross Margin % = Markup % / (1 + Markup %) |
Pay attention to the second formula: a 30% markup results in a 23.1% margin, which is lower than many teams expect. For example, a $100 cost with a 30% markup yields a $130 price and $30 gross profit on $130 revenue. Treating markup and margin as equivalent leads to overestimated profitability on every quote, even before discounts. This confusion appears in about half of the mid-market price files we review and should be addressed first.
When Does Cost-Plus Pricing Actually Work?
To be fair to the method, cost-plus pricing is the right tool in a handful of situations:
- Contract and OEM work that requires cost justification. Government and large OEM contracts often mandate a cost buildup, sometimes with audited markups. Here, the method is a contractual requirement.
- True pass-through commodity categories. When the market prices off a public index (steel, resin, copper), an indexed cost-plus formula with an escalator clause keeps quotes current and disputes rare.
- Brand-new products with no demand history. With zero sales data, a cost-based floor is a sensible starting point, provided you treat it as temporary and re-price once real transaction data arrives.
- The long tail. For C and D SKUs that generate 2% of revenue, the cost of sophisticated analysis exceeds the prize. A maintained markup table is perfectly rational there.
Even in these situations, use the formula as a pricing floor and allow the market to determine the ceiling. If a customer is willing to pay more, cost-plus pricing forfeits that additional margin.
Where Does Cost-Plus Pricing Kill Your Margin?
The real damage comes from what we call cost-plus autopilot. The price file runs on its own, and nobody owns the outcome, so the margin drifts away one invoice at a time. Anyone who has rebuilt a distributor’s price file after five years of autopilot knows the pain. Five leaks do most of the damage.
1. Stale costs. Supplier increases land monthly; price reviews happen annually. During the lag, your markup is applied to a cost that no longer exists. Mid-market manufacturers commonly run a gap of around 6% between cost increases and net price increases because their review cycles are too slow, a pattern we see constantly in manufacturing pricing engagements.
2. One markup for everything. A single blanket markup overprices your most competitive A items (you lose volume) and underprices the captive, hard-to-source items customers would pay far more for (you give away margin). The average looks fine. Both tails bleed.
3. Cost-to-serve blindness. “Cost” in most price files means invoice cost. Freight, small-order handling, expedites, returns, and payment terms live elsewhere. Picture two accounts with identical revenue. Customer A places 20-pallet orders, prepays, and takes 1 shipment per month. Customer B orders daily in small quantities, expedites half of those orders, returns products regularly, and requires manual invoicing. Same revenue, same blanket markup, completely different profitability. A 23% paper margin on Customer B can easily be a negative pocket margin, and the price file treats both accounts as equals.
4. Discounts stack on top. The list price may be cost-plus, but what you actually bank is the pocket price: list minus on-invoice discounts, promotions, rebates, freight given away, and payment terms. Cost-plus pricing governs the first number and says nothing about the rest of the waterfall. That gap between list and pocket is where realization dies; our guide to your true net price decomposes every stage of it.
5. Falling costs hand the gains back. When input costs decline, a mechanical cost-plus pricing rule automatically cuts your prices, donating the entire windfall to customers whether they demand it or not. Competitors on the same formula follow, and the whole category resets to a lower level.
Combined, these issues result in 2 to 4 percentage points of gross margin erosion, last-minute discounting to meet volume targets, and ongoing disputes between sales and finance over reported figures.
What Are the Alternatives to Cost-Plus Pricing?
Three approaches to modern pricing practice are cost-plus pricing, market-based pricing, and value-based pricing. Most manufacturers and distributors run some blend of all three, whether they have named it or not.
| Dimension | Cost-Plus | Market-Based | Value-Based |
| Price basis | Internal cost + markup | Competitor and index prices | Customer willingness to pay |
| Data required | Cost file only | Competitive quotes, indices | Transactions, win/loss, segments |
| Margin outcome | Capped at markup; erodes with lag | Follows the market up and down | Captures value where it exists |
| Best for | Contracts, tail SKUs, new items | Commodity lines, transparent markets | A items, differentiated products |
Two additional terms are relevant. Dynamic pricing adjusts prices continuously based on demand, inventory, and competitive signals; for most mid-market distributors, this is practical primarily in e-commerce channels. Hybrid pricing is the most effective approach: maintain a cost floor for every SKU, use market-based prices for commodity lines, and apply value-based pricing to differentiated A items. Most successful mid-market programs use this hybrid model.
It is important to clarify that value-based pricing is not guesswork. Willingness to pay is estimated using transaction history, win/loss analysis, price elasticity, customer segmentation, and competitive positioning. This analysis relies on data already available in your ERP and CRM systems.
The three approaches map onto one picture, the price corridor:
| The price corridor (top = ceiling, bottom = floor) |
| Customer willingness to pay: the ceiling |
| Value-based price targets sit just under the ceiling |
| Competitor prices pull you up or down inside the range |
| Market-based price targets track the middle |
| Your cost: the floor. Cost-plus pricing starts and stops here |
What Does the Damage Look Like in Dollars?
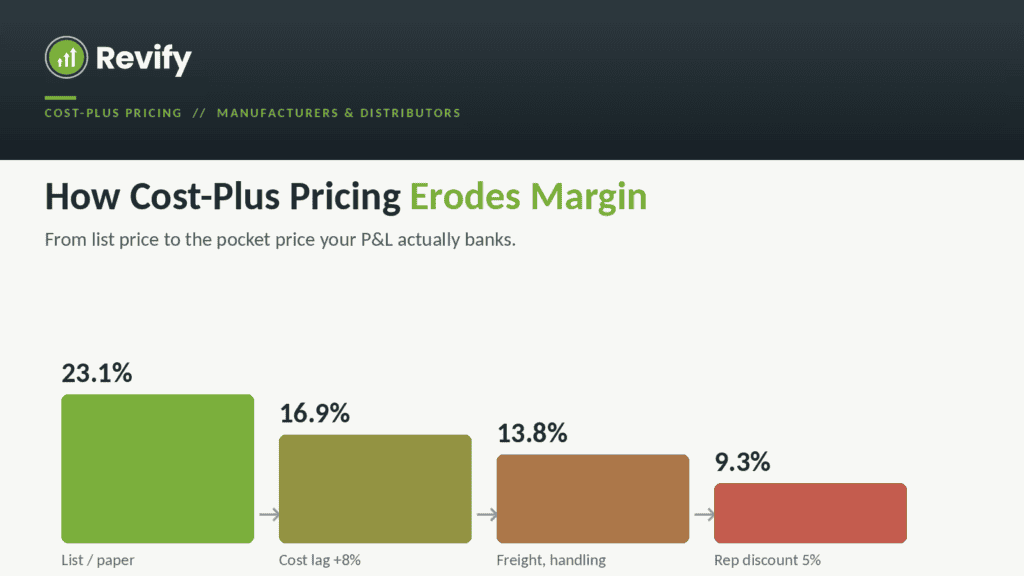
Here’s a scenario we see repeatedly, with illustrative numbers. Assume a distributor sells an industrial SKU with a $100 invoice cost, a standard 30% markup, and a $130 list price.
The price file shows a 23.1% margin, but the P&L records only 9.3%. On $10 million in revenue, this 13.8-point gap represents approximately $1.4 million in gross profit that is not realized. Additional deductions from rebates, promotions, and payment terms further reduce profitability. Addressing cost-plus pricing mechanics is often the quickest way for mid-market companies to improve margins.
| Case in point (anonymized). One industrial distributor discovered that 14% of SKUs generated nearly all of its margin leakage. The blanket markup had been underpricing proprietary replacement parts, where customers had nowhere else to go, while overpricing competitive commodity items, where every quote was contested. Segment-specific pricing recovered the margin without losing volume: the proprietary parts absorbed the increases, and the sharpened commodity prices held share. |
Cost-Plus Pricing Myths vs. Reality
| Myth | Reality |
| Cost-plus guarantees profits | It guarantees only a paper margin; lag, cost-to-serve, and discounts decide the rest |
| Thousands of SKUs force cost-plus | The tail can stay on markups; high-profit SKUs deserve differentiated pricing |
| Value pricing ignores costs | Costs establish the floor in every approach; value sets the ceiling |
| Sales won’t accept pricing rules | Most sales teams welcome consistent guardrails once win rates hold |
How Do You Move Beyond Cost-Plus Pricing Without a Pricing Team?
You do not need to abandon cost-plus pricing everywhere, and you certainly do not need a ten-person pricing department. You need a decision rule and an operating cadence.
Retain cost-plus pricing for contractual cost-buildup work, index-priced commodities, and low-value SKUs in the long tail. Document each use as a deliberate decision.
Fix the mechanics everywhere else before changing the philosophy:
- Refresh costs monthly (or on supplier notice), and re-quote within days.
- Differentiate markups by SKU role and customer segment rather than a single blanket rate.
- Load cost-to-serve (freight, handling, small-order penalties) into the “cost” that the markup applies to
- Put guardrails and an escalation path around discounting, so the pocket price is governed alongside the list price.
For critical SKUs and segments—such as A items, differentiated products, and captive categories—replace cost-plus pricing. Set prices based on transaction data, win/loss analysis, and competitive positioning. Use analytics to define the range, and assign a responsible owner to make final pricing decisions.
A note on AI: modern AI tools accelerate pricing analysis by detecting margin leakage, estimating price elasticity, recommending customer segments, and identifying unusual discounts across large volumes of transactions. However, pricing managers remain responsible for final decisions, underscoring the importance of governance.
The payoff for this discipline is well documented. According to Revology’s research of 2,000 global companies, a 1% improvement in price realization produces a 6-7% lift in operating profit; excluding highly regulated industries, the figure is in the 10-11% range (“Pricing Still Packs a Punch,” Revology Analytics, June 2025).
Three common objections arise. “Our customers demand cost transparency”: some do, and they can remain on documented cost-plus contracts, while other accounts transition. “We have 12,000 SKUs and cannot price each individually”: this is unnecessary; the framework focuses on the few hundred SKUs that drive profit. “Sales will resist”: in practice, sales teams appreciate clear guidelines when they see stable win rates and increased commissions from better pricing. The main trade-off is effort. Implementing these changes requires a focused quarter of work, followed by a consistent monthly review, but the returns are significant.
Where Does Your Company Sit on the Pricing Maturity Curve?
| Level | Pricing approach |
| Level 1 | Cost-plus pricing everywhere; annual price updates |
| Level 2 | Cost-plus pricing with discount control and guardrails |
| Level 3 | Segmented pricing: markups differentiated by SKU role and customer |
| Level 4 | Value-based pricing on key items and segments |
| Level 5 | Analytics and governance running as a weekly operating cadence |
Most mid-market manufacturers and distributors sit at Level 1 or 2. The jump to Level 3 captures the bulk of the money, and it fails more often from adoption than from analytics; we wrote about why RGM platforms fail the mid-market for exactly that reason.
What Do You Do Monday? The First 90 Days
| When | Action |
| Week 1 | Separate markup from margin in the price file; correct every report that confuses them |
| Week 2 | Measure cost lag: date of last supplier increase vs date of last price update, by category |
| Week 3 | Identify the top 100 SKUs by gross profit contribution; these get priced deliberately |
| Week 4 | Quantify discount leakage: list price vs pocket price across the top 50 customers |
| Month 2 | Build customer and SKU segments; set differentiated markups and discount guardrails |
| Month 3 | Pilot value-based pricing on one captive category; measure win rates and margin weekly |
| Where Revify fits. Revify exists for exactly this gap: manufacturers and distributors between $10M and $1B in revenue that have no pricing team and no appetite for an 18-month software project. Our RGM solution pairs purpose-built analytics (net price realization, discount analysis, margin drivers, SKU profitability) with senior pricing advisors who run the keep-fix-replace work with your team. Engagements start with a diagnostic that quantifies your cost lag, markup dispersion, and discount leakage in dollars, so you know the size of the prize before committing to anything. If cost-plus autopilot has been running your price file, talk to us and we’ll show you where to look first. |
Cost-Plus Pricing FAQs
What is cost-plus pricing, and what is an example?
Cost-plus pricing sets the selling price by adding a fixed markup to unit cost. Example: a part costs $50 and carries a 40% markup, so the price is $50 x 1.40 = $70. The $20 of gross profit yields a 28.6% margin.
What is the difference between markup and margin in cost-plus pricing?
Markup is profit as a percentage of cost; margin is profit as a percentage of price. A 30% markup equals a 23.1% margin. Confusing the two overstates profitability on every quote.
What are the main disadvantages of cost-plus pricing?
It ignores customer willingness to pay, applies stale costs during supplier increases, omits cost-to-serve, does nothing to govern discounting, and automatically passes cost declines through to customers.
When should a distributor use cost-plus pricing?
For contract work requiring cost justification, index-priced commodities, brand-new items with no sales history, and long-tail SKUs, where analysis costs more than it returns. Everywhere else, treat cost as a floor and price to the market.
What is the alternative to cost-plus pricing?
A hybrid approach: keep a cost floor on every SKU, apply market-based prices on commodity lines, and use value-based or market-informed prices on the A items and key segments, supported by discount guardrails and a monthly review cadence.
Key Takeaways
- Cost-plus pricing guarantees a paper margin; cost lag, cost-to-serve, and discounting decide the pocket margin your P&L actually collects.
- Costs set the floor, customer value sets the ceiling, and competition decides where you land inside that range.
- A 30% markup is a 23.1% margin, and markup-margin confusion inflates every profitability estimate.
- The five silent leaks are stale costs, blanket markups, cost-to-serve blindness, ungoverned discounting, and automatic pass-through of cost declines.
- Keep cost-plus for contracts, commodities, and the tail; fix its mechanics everywhere; and replace it on the A items where profit is concentrated.
- A 1% gain in price realization lifts operating profit 6-7% (Revology Analytics, 2025), which makes this the biggest single fix available to most mid-market P&Ls
A price file represents a series of decisions, whether they are made intentionally or not. Make those decisions deliberately.
| Start Your Profit Diagnostic.A focused working session that quantifies your cost lag, markup dispersion, and discount leakage in dollars, so you know the size of the prize before you commit to anything. |
About the author
| Enrico SieniCo-Founder, Revify AnalyticsEnrico Sieni has spent more than two decades leading pricing and revenue growth for manufacturers and distributors. He has built and run three pricing teams from the ground up, which is part of why he is convinced most mid-market companies do not need one of their own. At Revify Analytics he helps these companies install the discipline, governance, and seller-level tracking that turn price realization from a once-a-year surprise into a number they manage every week. He writes about the practical side of pricing: what actually moves margin, and what only sounds good in a deck. |